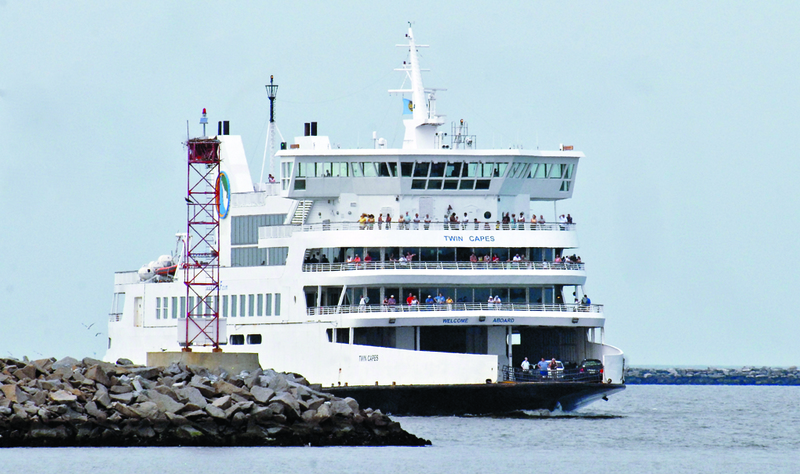
Cape May-Lewes Ferry provides vessel for research
As the Cape May-Lewes Ferry hits open water, water splashes against the bow, where it finds a small opening leading to a monitoring device that measures the Delaware Bay's vital signals.
As passengers on the ferry enjoy their peaceful ride, scientists on land can review real-time data collected during the trip to understand how water temperature, salinity and other measurements could be affecting the health of the Delaware Bay.
Thanks to a partnership between the University of Delaware and Delaware River and Bay Authority, those daily crossings provide an easier and more economical way to study changes in the bay's environment.
“It's a project I'm really excited about, both scientifically and because of the potential partnerships,” said Dana Veron, a research project leader and associate professor of geography at UD's College of Earth, Ocean and Environment.
For the first time, more than four years of data collected at the mouth of the Delaware Bay, including water temperature and salinity, can be accessed by scientists and students beyond UD's campus. Veron recently announced that information can be found through the university's Delaware Environmental Observing System, which over the past 11 years has recorded more than a billion environmental data points – such as weather conditions, tides and temperatures – near and throughout the state.
As one monitoring system in the bow of the ferry collects information about pH levels and dissolved carbon dioxide, a second system above the wheelhouse operates much like a typical weather station by measuring air temperature, air pressure, humidity, and wind speed and direction. Combining those readings, which are taken every time the ferry makes its daily crossings, will provide valuable tools for researchers with any organization – from high school students to National Weather Service experts.
Studying the data could reveal environmental changes that point to significant trends, such as acidification in the ocean reaching the bay or allow for more accurate predictions of sea breezes. A GPS system helps keep track of the exact location each measurement is collected and a wireless system sends the data back to land.
“It's great to have those observations because we can compare them to measurements over the last 30 years and see how it's changed and make some predictions,” Veron said.
Previous research on the Delaware Bay relied on 2-to-3-day comparatively expensive cruises on research vessels, making it difficult to collect a steady flow of information, explained retired UD professor Dr. Jonathan Sharp, who began selling the idea of the ferry monitoring system in 2008.
“What we have characterized as a normal situation for the Delaware Bay with over 30-some-years of research, we see it's possibly changing,” he said. “With the ferry monitoring, we're able to understand that a little better.”
The Twin Capes, the Cadillac of the fleet, was the first vessel to gather data during the summer months of 2011, 2012 and 2013, after Sharp garnered funding support and approvals to drill a hole in the front of one of the DRBA's ferry boats.
“That's quite an imposition, to ask them to take their commercial activity and put a hole in the front of the boat,” he said. But they agreed.
By early 2014, after the DRBA retired the Twin Capes, The New Jersey became the new ship of opportunity. Currently, Sharp said, researchers are fitting the Cape Henlopen so that the system can be transferred between the two ships.
To service the research equipment, Veron, project co-lead and UD oceanography professor Wei-Jun Cai and assisting graduate students have a window of about 20 minutes between trips to pop in and out of a high-clearance area where the water-measurements are taken.
But back in the lab, there's barely enough time to read the vast amount of data points transferred in any given week. That's why Veron, Cai and Sharp hope that by having that data publicly available, researchers working on other projects may find it beneficial in their own work.
“Frankly, there's more data here than anybody can normally work with,” Sharp said. “Maybe some student in 11th grade in some school in Pennsylvania might discover a weird thing going on. We want to get these data rapidly accessible to anyone who wants to look at them because there's tremendous value for research, for better understanding and monitoring activities.


